
Find your Golden Goose Picks
When small eggs hatch they become big birds


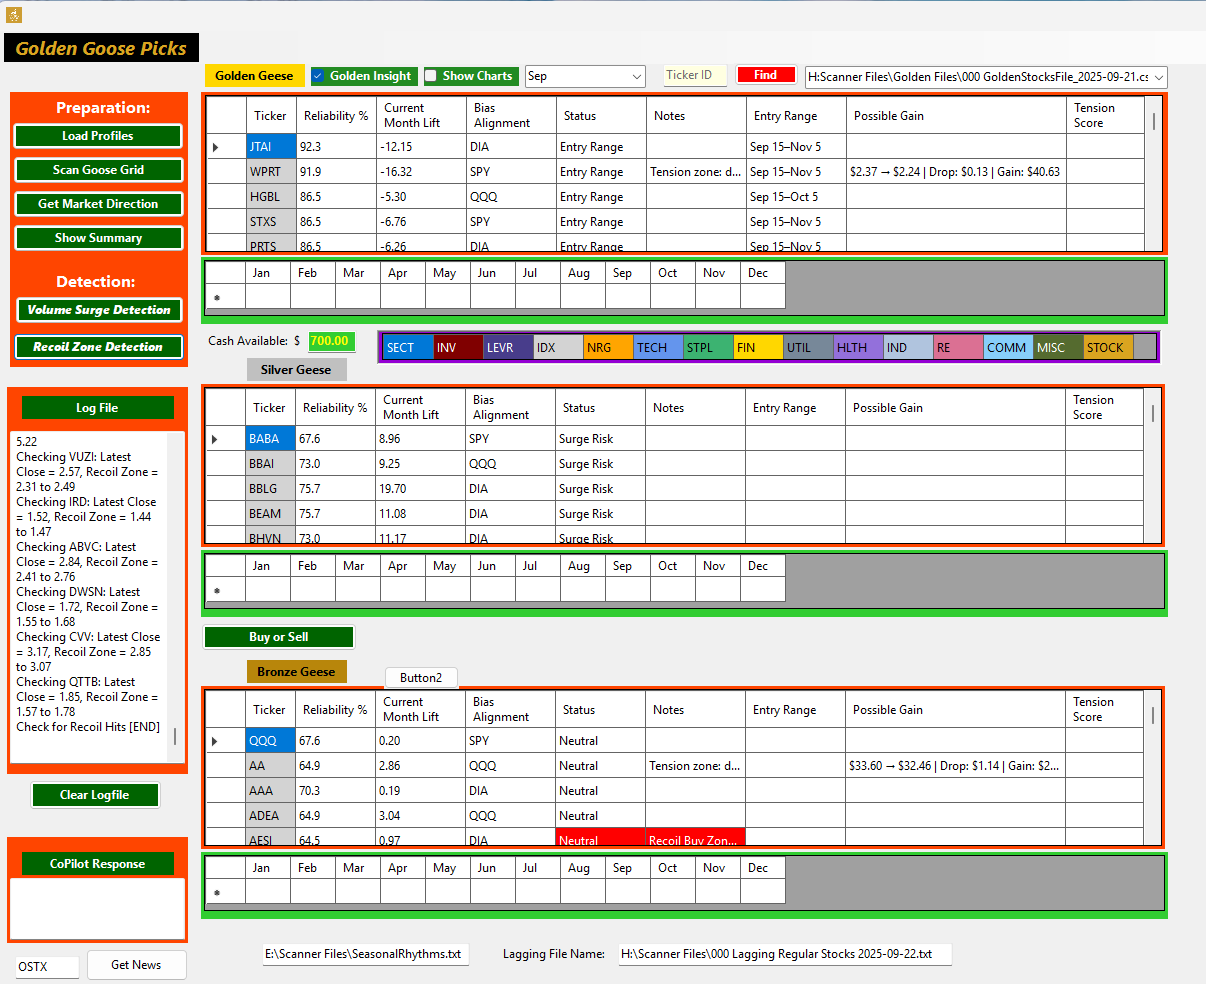
Why spend hours researching stocks? Our AI-powered scanner—built with Microsoft Copilot—does the heavy lifting. It tracks behavioral tension zones, flush traps, and recoil setups across 1,500+ tickers daily. We post the curated list every week, with mid-week updates as new setups emerge.
Our scanner calculates all the usual technical indicators—moving averages, RSI, MACD, and more—for every stock in our universe. But it doesn’t stop there.
It tracks price surges and volume spikes to surface setups with real tension and potential value. More importantly, it identifies behavioral patterns that most stocks follow after a run-up—flush traps, recoil zones, and compression setups that often precede tactical bounces.
This isn’t just technical analysis. It’s behavioral profiling, built with AI and refined through real-world execution.